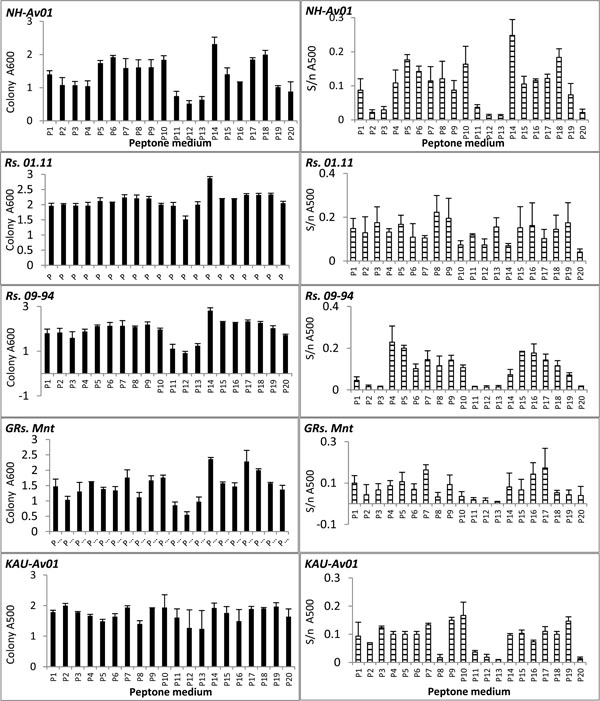
Fig. (6)
Colony growth as per OD at A600 (left panel) and extent of colony
pigmentation as per A500 (right panel) of different isolates of
Ralstonia solanacearum from various crop sources or geographic locations on
KM-TTC documented on day 2. P1-P19 represents 19 KM-TTC peptone formulations
with different brands and lots as in Table 2 and P20 represents CPGA
control. The isolates included ‘NH-Av01’ from tomato, ‘Rs.01.11’ from eggplant,
‘Rs. 09-94’ from chilli, ‘GRs-Mnt’ from ginger and ‘KAU-Av01’ from tomato.