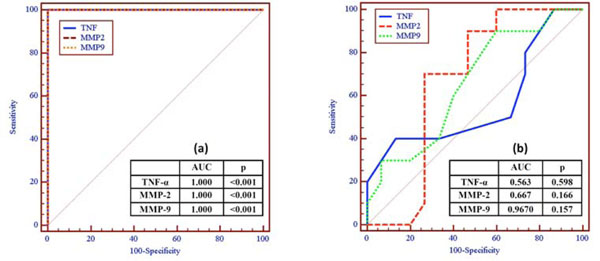
Fig. (2)
ROC curve of MMP-2, MMP-9 and TNF-α levels for discriminating: (a) chronic HCV patients (F1-F4) from healthy control (F0), and (b) fibrotic cases (F1-F3) from cirrhotic cases (F4).