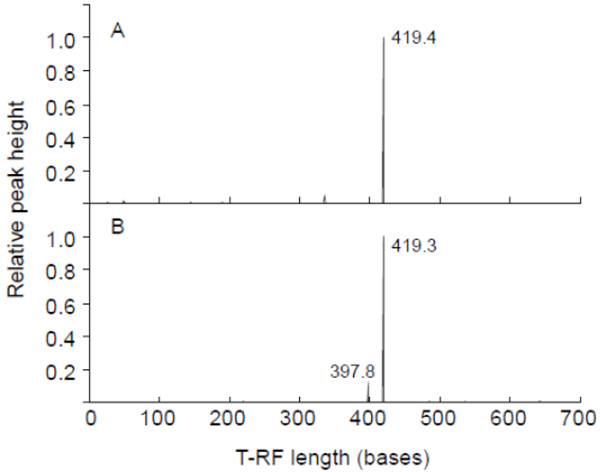
Fig. (1) T-RFLP profiling of the cyanobacterial 16S rRNA gene
amplified as template total DNA of the gastric content of dead
egrets. KS2P (A) and KS4P (B) were used for PCR amplification.
HaeIII was used for digestion. The x-axis indicates the terminal
restriction fragment length (bases) between 0 and 700 bases, and
the y-axis represents the relative height of the peak. The highest
peak was calculated as 1. A relative height of over 0.1 showed the
T-RF length.