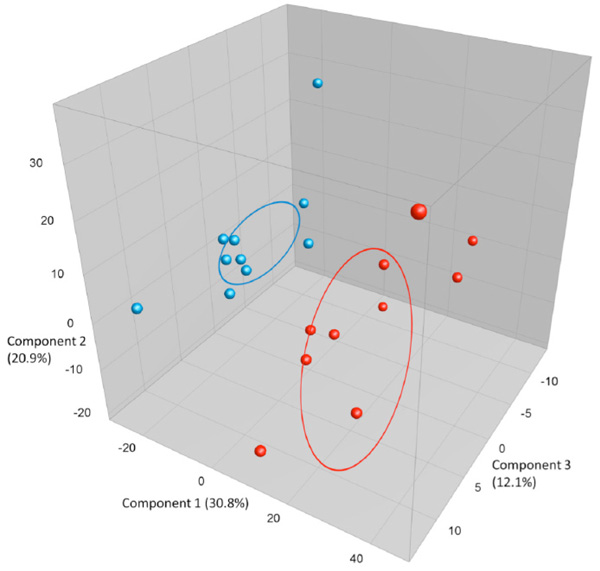
Fig. (1b) PCA plots based on DGGE profiles of 16S rRNA gene PCR-derived amplicons of blue BAL and red caecum samples collected from nine-weeks-old naïve female BALB/cj (n=10). DGGE: denaturing gradient gel electrophoresis after DGGE-PCR: polymerase chain reaction. There is a group to the left that consists of all BAL samples clustering separately from the caecum. The variation between the BAL samples is much lower than between the caecum samples.