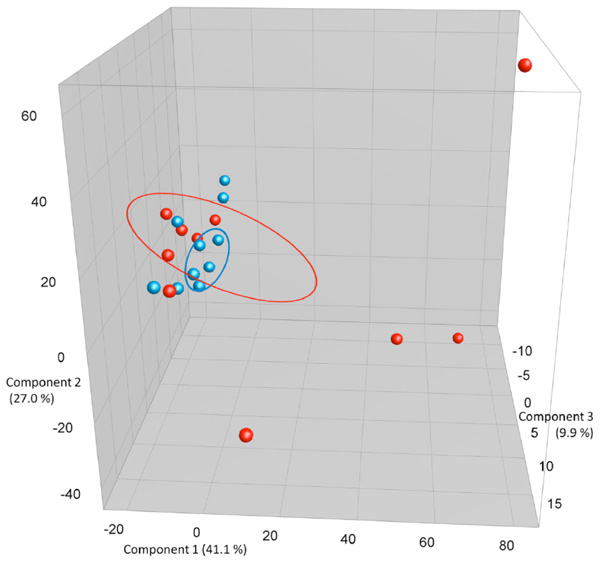
Fig. (2b) PCA plots based on DGGE profiles of 16S rRNA gene PCR-derived amplicons of BAL samples collected from C57Bl/6 dams exposed i.n. to either PBS or CNT particles. The colors represent red: CNT dams and blue PBS dams (n=20). DGGE: denaturing gradient gel electrophoresis after DGGE-PCR: polymerase chain reaction. There is a group to the lower left that consists of both control and CNT dams, but the outliers that cluster separately are all CNT.