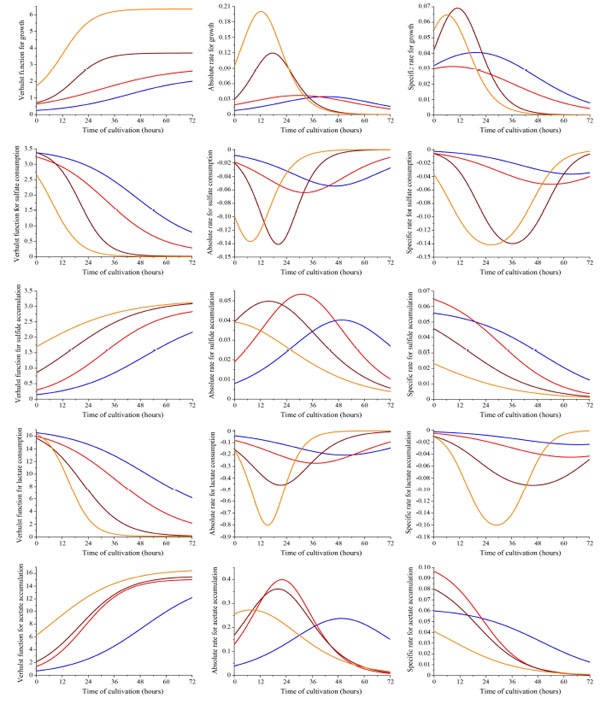
Fig. (3) Curves of the dissimilatory sulfate reduction process depending on Desulfovibrio piger Vib-7 initial cell concentration (blue, red, brown, and orange line indicates the initial concentration of bacterial cells: 0.12±0.011, 0.25±0.024, 0.5±0.048, and 1.0±0.096 mg/ml, respectively). First column (5 graphs) shows the obtained logistic Verhulst function for each parameter of the sulfate reduction. Experimental data are approximated by a logistic Verhulst function where C and A are the lower and upper asymptote of the function, and α and β parameters determining the behaviour of the function. Second column (5 graphs) shows the obtained absolute rate. Third column (5 graphs) shows the obtained specific rate (hour-1) for each parameter of the sulfate reduction depending on initial bacterial cell concentration.