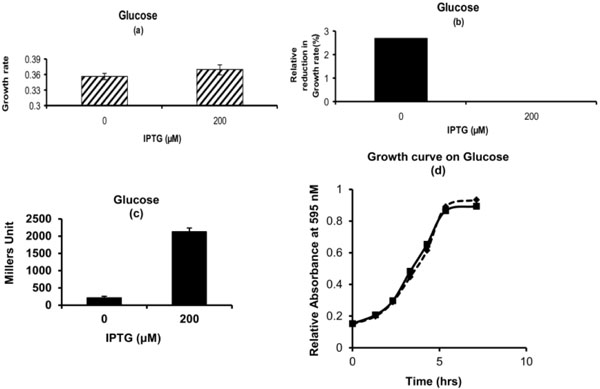
Fig. (2) Phenotypic Growth Properties on Glucose: (a) Growth rate for cells with and without pre-exposure to IPTG. (b) Percentage Relative reduction in growth rate for cells which are not exposed to IPTG in pre-culture as compared to the ones which are exposed to IPTG. (c) β-galactosidase activity for cells which are exposed to IPTG or not in pre-culture. (d) Growth Curve. Dashed Line with diamond represents the cells which are exposed to 200 μM of IPTG in M9 glycerol medium in pre-culture. Solid Line with square represents the cells which are not exposed to IPTG in M9 glycerol medium in pre-culture. Glycerol (1g/L) and Glucose (4g/L) was used in experiment.