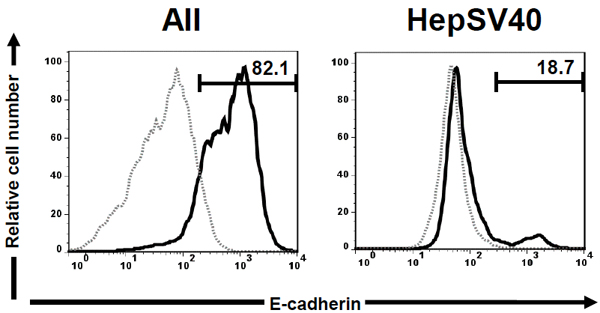
Fig. (1) Cell surface expression of murine E-cadherin on AII and HepSV40. AII and HepSV40 were stained with carboxyfluorescein-
conjugated anti-mouse E-cadherin mAb and the E-cadherin surface expression was analyzed by flow cytometry. The profiles of
E-cadherin are displayed as histograms. Dotted and solid lines represent LPC lines unstained and stained with anti-mouse E-cadherin
mAb. Numbers in histograms represent percentages of E-cadherin+ cells. Representative staining patterns from 2 independent experiments
are shown.