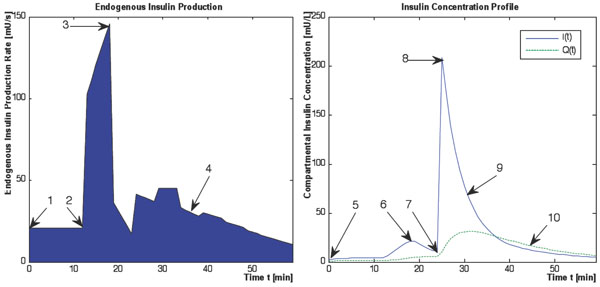
Fig. (2) A typical endogenous insulin production and resulting insulin concentration response to the DIST protocol. Shown are the endogenous insulin secretion rate profile Uen(t) (left), and the plasma and interstial insulin concentrations, I(t), Q(t), (right). The kinetic features required to describe the profiles in the absence of insulin and C-peptide data are shown by numbers 1-10.