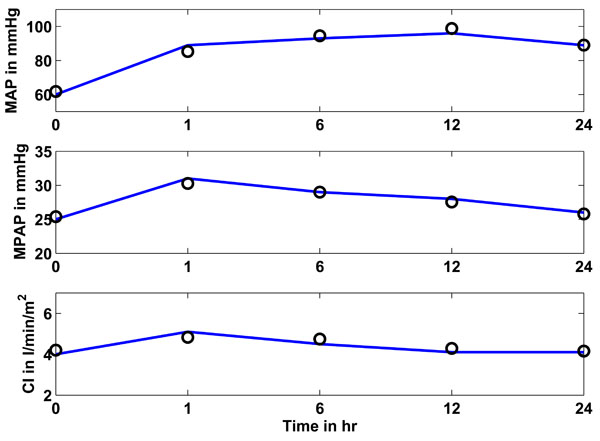
Fig. (8) Study 3: Clinical mean arterial (MAP), mean pulmonary artery (MPAP) pressure and cardiac index (CI) as obtained from [17] vs simulated pressures and CI. Solid lines represent the clinical data and circles represent the CVS model simulation output using identified patient-specific parameters.