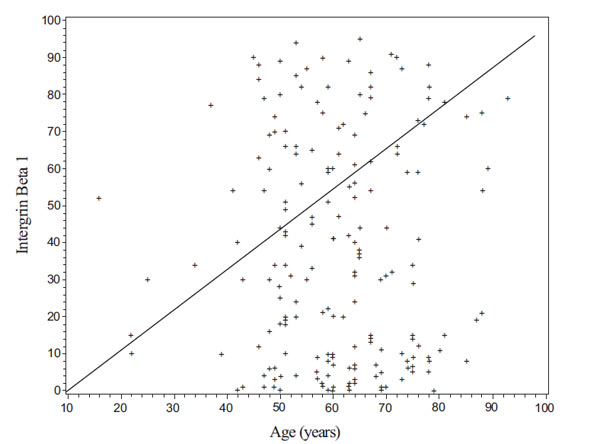
Fig. (6)
A scatter plot of patient’s Intergrin Beta 1 value by his/her age in years.