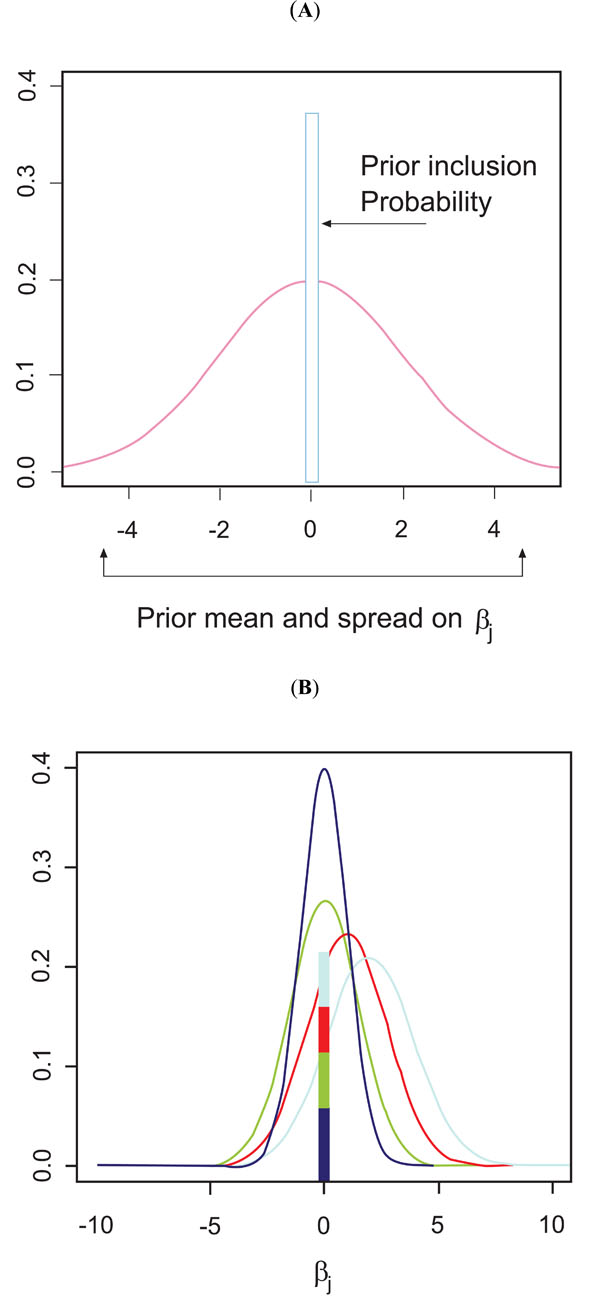
Fig. (1) Prior illustration for the models. For each codon position j, the column shows δj, the prior 0/1 indicator if codon j is important to the fitness phenotype. The curve shows the prior distribution on the regression coefficient βj. (A) Model 1, the uninformative prior. All codon positions have the same prior. (B) The Exchangeable on Subsets Prior (ESP). In the figure, 4 subsets are shown. Each codon within a subset has the same prior δj and prior distribution on βj. Different subsets have different values for the priors on the δj’s and βj’s. The four subsets are shown in different colors.