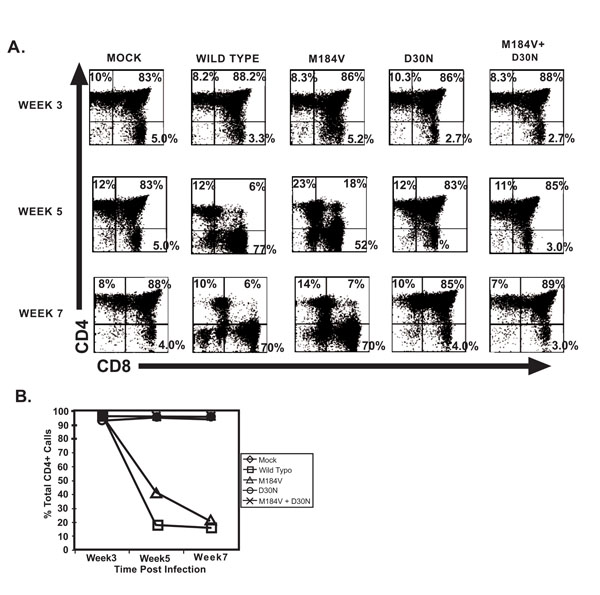
Fig. (4) Depletion of CD4-bearing cells following infection with wild-type, M184V-containing, D30N-containing, and M184V and D30N-containing viruses in vivo. (A) CD4 versus CD8 flow cytometry staining profiles were determined on biopsied thy/liv tissue at the indicated times following infection with one of the four indicated viruses. Cells were stained with monoclonal antibodies (and their corresponding fluorochromes) to CD45 (FITC), CD8 (ECD), and CD4 (APC). CD4 and CD8 profiles of this population are given by gating on the human CD45+ population of cells. The percentages of cells in each quadrant are indicated. The data is representative of one mouse per group (total of 5 mice per group) of a total of three experiments. (B) Graphic representation of the percentage of total CD4+ cells in the respective thy/liv implants over time.