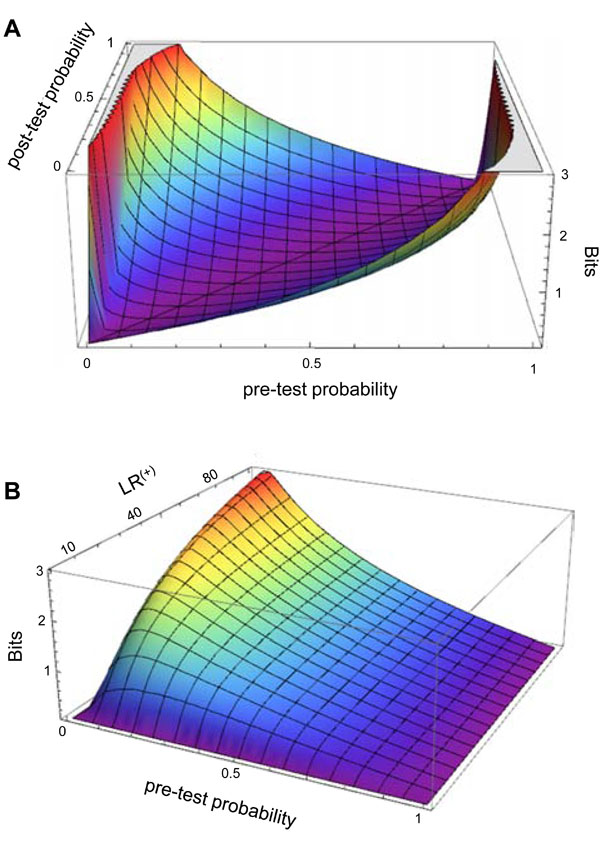
Fig. (3) information gain function. (A) The information gain (Z-axis
contour) is shown in relation to any given combination of pre-TP (X-axis) and post-TP (Y-axis) values. The information gain is
low when the pre-TP and the post-TP are similar to one another
(purple “valley”), and high when they are different from one
another. (B) Information gain (Z-axis) is shown in relation to
combinations of pre-TP (X-axis) and a spectrum of LR(+) values
(Y-axis).