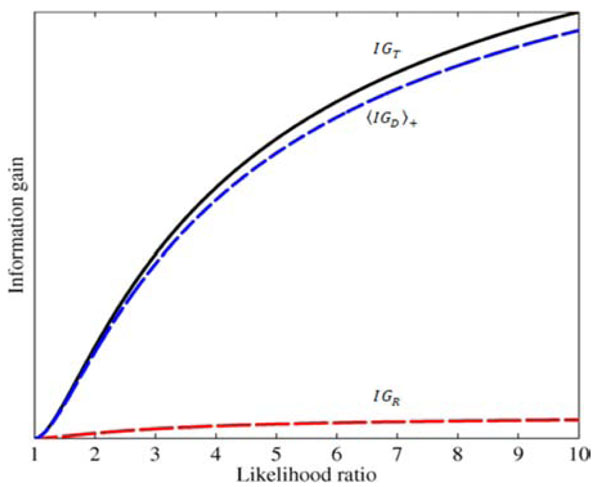
Fig. (8) Effects of test results on diagnostic information gain.
The total information gain IGT (solid black curve), and the two
components in the sum IGT = IGR + IGD+ , are shown as a function
of the positive likelihood ratio. The range information gain IGR is
the lower red dashed curve, and the disease information gain is the
middle blue dashed curve. These curves are computed using the
distribution over pre-TP values from Fig. (6C).