Fig. (20)
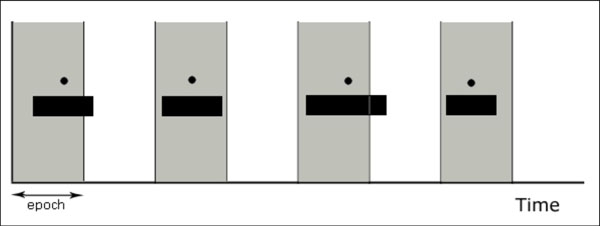
Each black rectangle represents an apneic event over a time scale (the x axis). The circles represent the mid-points that locate apneic events unequivocally in an epoch (in grey).