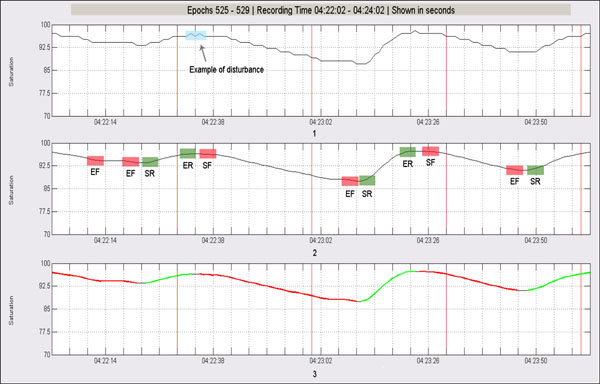
Fig. (7) Analysis
of SaO2 signal. (1) Original signal: a disruption on the signal is
highlighted.(2) Smoothed signal where patterns start of fall (SF), end
of fall (EF), start of rise (SR) and end of rise (ER) have
been detected. (3) Original signal has been segmented according to possible
desaturation (red) and resaturation events (green).