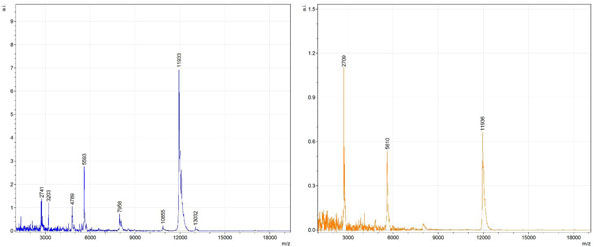
Fig. (5)
Representative positive ion mass spectra from AD case tissue (left) and the corresponding mass spectra from control case tissue (right). Spectra were taken from regions on tissue with a high intensity of
m/z
equal to 11934.