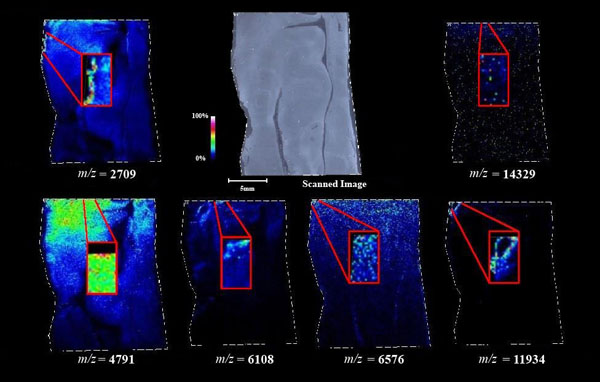
Fig. (8) Positive ion MALDI-TOF images of representative masses from control hippocampal tissue runs. The anatomy is comparable to (Fig 7), although these samples were sectioned on a different plane. Each pixel represents a mass spectrum. Red boxes: zoom-ins of most intense areas.