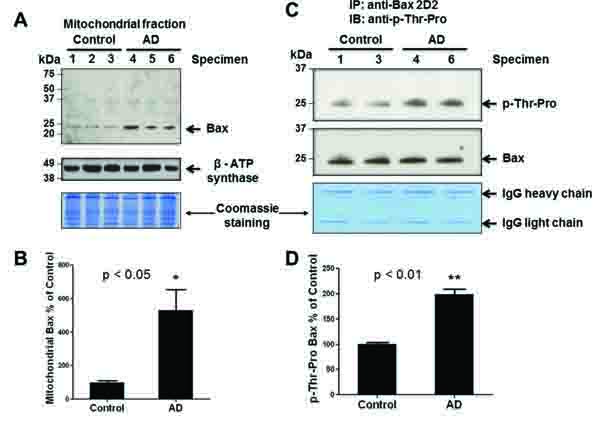
Fig. (3)
An increase in mitochondrial Bax and phosphorylated Bax. (A) Equal amounts of proteins (100 μg/well) from the crude mitochondrial fractions from AD and control individuals were separated on 15% SDS-PAGE, transferred to PVDF-Immobilon, and subjected to immunoblot analyses for Bax (top panel) or ATP synthase-β subunit (middle) and Coomassie blue stained (bottom). (B) Densitometric quantitation of mitochondrial Bax in AD patients relative to control subjects is presented. P<0.05. (C) Equal amounts of mitochondrial proteins from the two randomly-chosen specimens per group (400 μg protein/analysis) were incubated with 2 ug of anti-Bax antibody (2D2 or 6A7) to immunoprecipitate the mitochondrial Bax protein. Immunoprecipitated Bax proteins were then subjected to IB analysis using a specific antibody against phospho-Thr-Pro (top panel) or Bax (middle). The remaining gel was stained with Coomassie blue (bottom panel) to demonstrate equal protein loading. (D) Densitometric quantitation of p-Thr-Pro-Bax in AD patients compared to control subjects is shown. P<0.01.