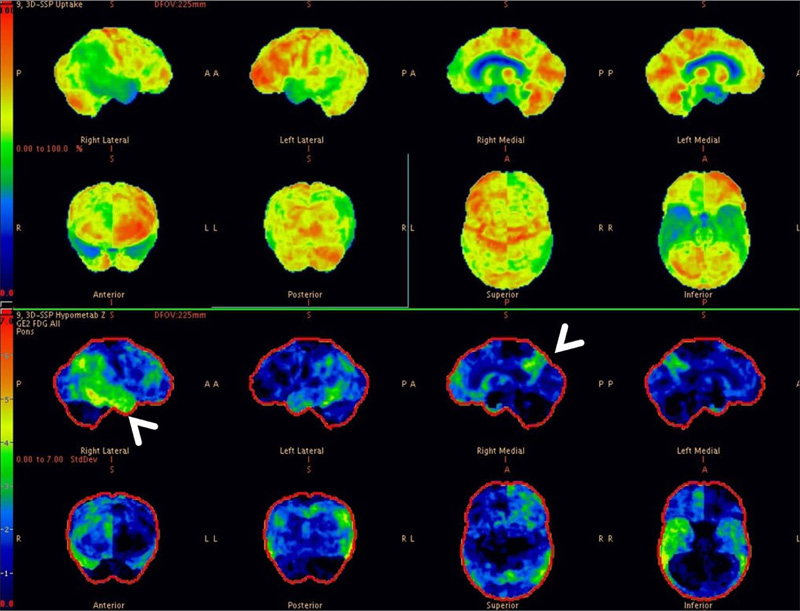
Fig. (2)
3-dimensional stereotactic surface projection images (generated using comparison with a normal standardized brain database, NeuroQTM software package, GE healthcare) showing relative glucose metabolism (top panel) and extent of hypometabolism (lower panel) in standard projections (Right lateral, left lateral, right medial, left medial, anterior, posterior, superior and inferior). These images also confirm the moderate glucose hypometabolism along bilateral parieto-temporal cortices (white arrowheads).