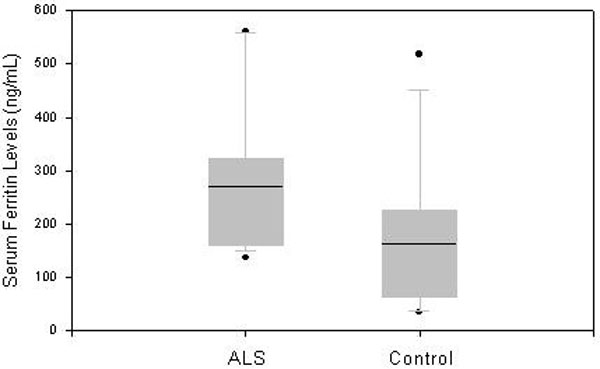
Fig. (1) The mean serum ferritin level in 17 male participants with ALS (269.9 ng/ml ± 126.4 SD) and 14 healthy controls (164.1 ng/ml ± 142.2 SD) is depicted in boxplot. The horizontal line reflects the median and the box provides the interquartile range from the 25th to 75th percentile. Dots represent the observations outside of 10th and 90th percentiles.