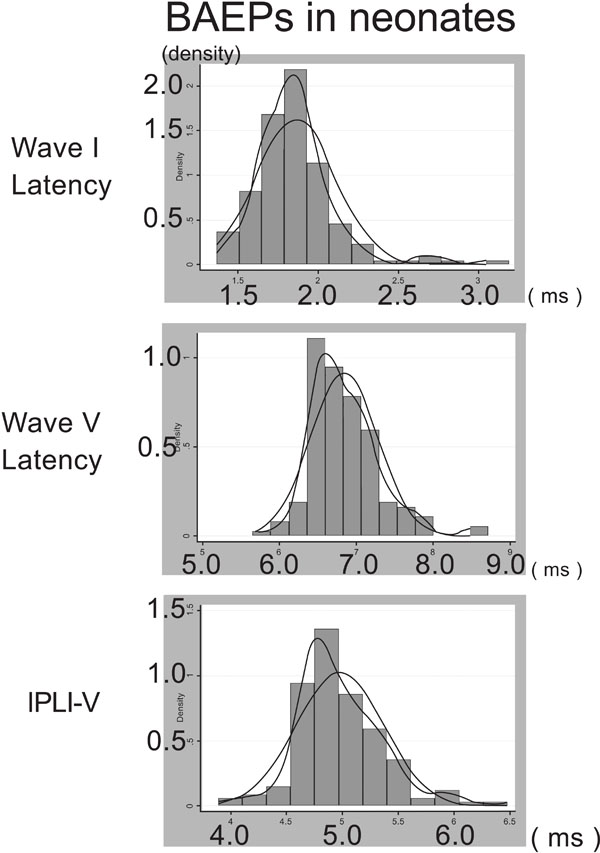
Fig. (1)
Merged right and left BAEPs in neonates. The panels show the histogram of distribution, normal distribution and density distribution of wave I (top), wave V (middle) and IPL I-V (bottom).