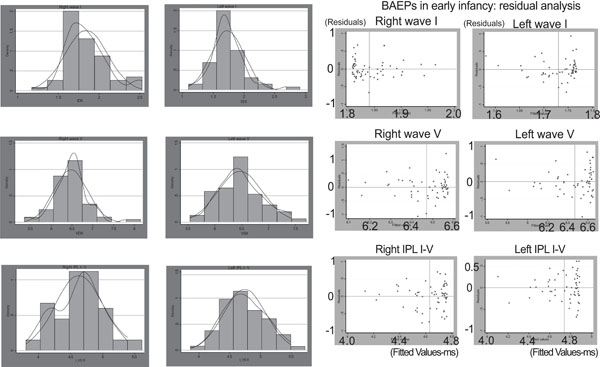
Fig. (2) a. Right and left BAEPs in early infancy. The panels show the histogram of distribution, normal distribution and density distribution of wave I (top), wave V (middle) and IPL I-V (bottom).b. BAEPs in early infancy: dot plots of the residuals of right and left wave I (top), right and left wave V (middle) and right and left IPL I-V (bottom).