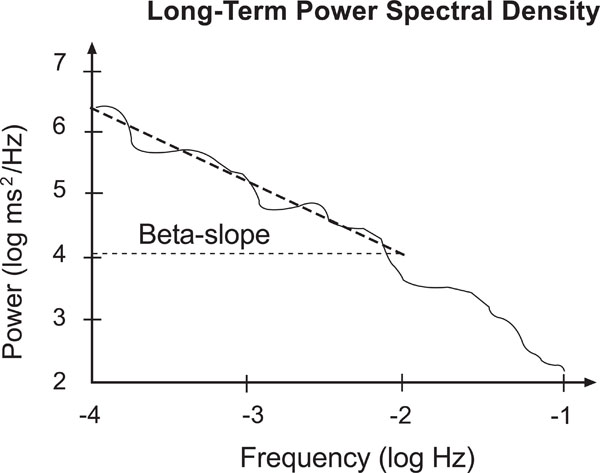
Fig. (2)
Sketch of a long term power spectrum. Note the slope of the fitted line between 10-4 and 10-2 Hz, respectively -4 and -2 in the logarithmic scale.