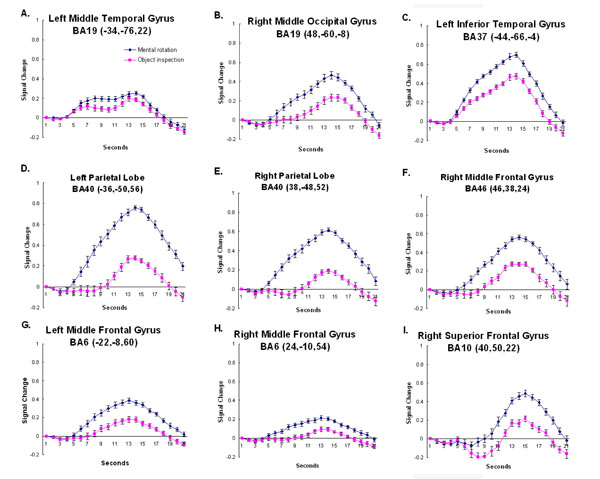
Fig. (5) The timecourse data from regions that revealed a larger response to mental rotation compared to object inspection. The coordinates indicate the location of the cluster centroid. Error bars represent 95% confidence intervals based on the pooled Mse from the corresponding ANOVA [31].