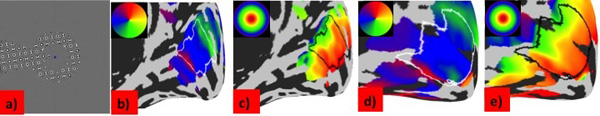
Fig. (1) Mapping stimulus and retinotopic maps. (a) In the scanner participants viewed rotating wedge and expanding ring stimuli containing a high contrast flickering checkerboard pattern whilst maintaining fixation on a small blue dot in the center of the screen. (b-e) Maps of population receptive field (pRF) parameters for a deaf (b, c) and a hearing (d, e) participant. Data are projected on an inflated model of the right cortical hemisphere. Polar angle (b, d), eccentricity (c ,e) are shown in deaf and hearing participants respectively. The region of interest in primary visual cortex included in the analysis is outlined in each map. All maps are thresholded at R²=0.1, corresponding to the model fit required for the inclusion of the data point for analysis.