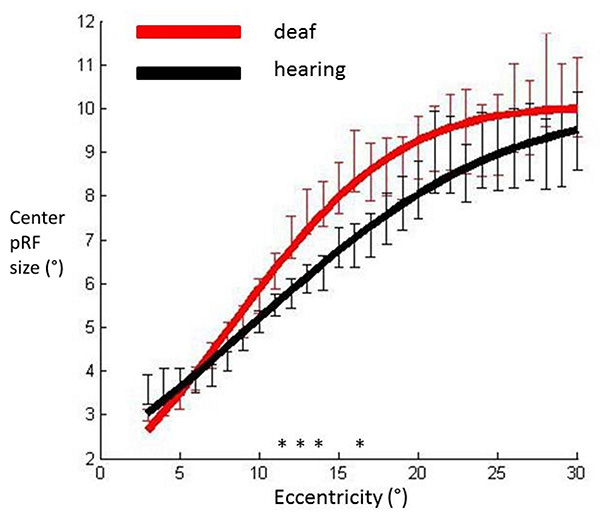
Fig. (4) pRF center sizes averaged across participants’ hemispheres in each group and plotted against eccentricity in primary visual cortex. Data have been fitted with a cumulative Gaussian curve. Independent samples t-tests were used to assess whether there were differences between groups for each eccentricity bin. Significantly different bins (p<0.05) are denoted with an asterisk. Red: Deaf participants, Black: Control group. Error bars denote +/- standard error of the mean.