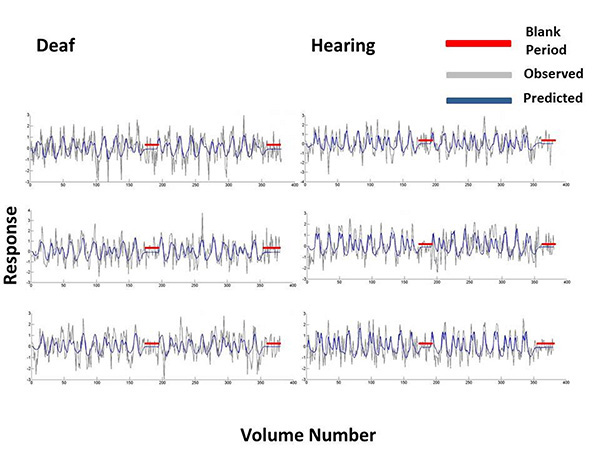
Fig. (6) For 3 participants from the deaf and hearing groups we plotted the Difference-of-Gaussian model predictions and bold time series data at vertices in primary visual cortex. These time series were selected on the basis that they were at the 80th percentile of all the model fits, when these were ordered from the poorest to the best fit. The model predictions are plotted in blue and the observed bold response at that vertex is plotted in grey. Blank periods in which a blank grey screen was presented rather than a mapping stimulus are highlighted in red.