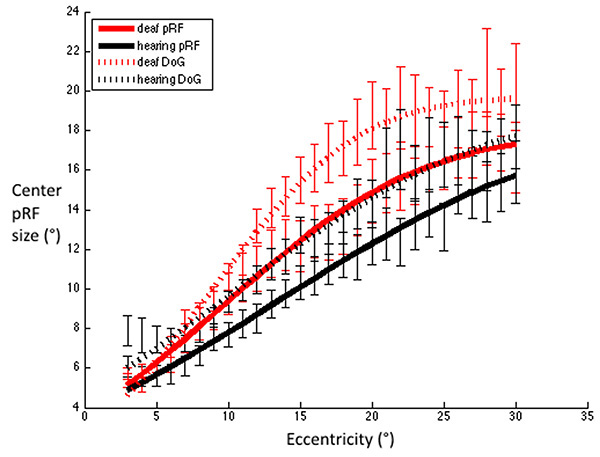
Fig. (7) FWHM for V1 were estimated using Difference-of-Gaussians and standard 2D Gaussian population receptive field models. Red dashed line: Deaf participants DoG, Black dashed line: Control group DoG. Red solid line: Deaf participants standard pRF, Black solid line: Control group standard pRF. Error bars denote +/- standard error of the mean. This demonstrates that irrespective of the model used to estimate the FWHM, the pattern of results is qualitatively the same, whereby deaf FWHMs are greater than those of the hearing group, and this difference is most notable in the near – far periphery.