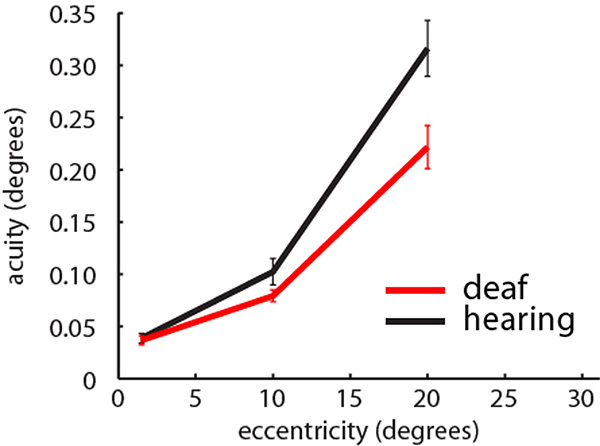
Fig. (8) Visual positional discrimination thresholds in the central (1.5°), middle (10°) and peripheral visual field (20°) averaged across participants in each group. Red: Deaf participants, Black: Control group. Error bars denote +/- standard error of the mean. Analysis is based on 13 deaf participants and 15 hearing participants.