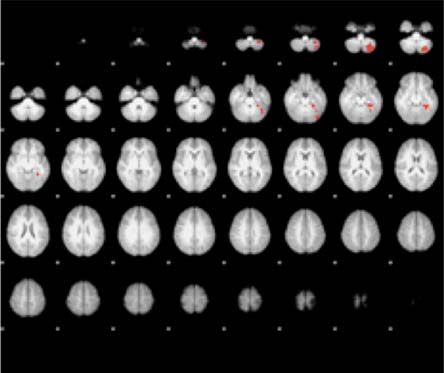
Fig. (3) Activation maps for contrasts of group averaged BOLD fMRI signal intensities for ASD and NT groups. Axial slices demonstrate average brain activations across participants and contrasts between groups using the FMRIB Local Analysis of Fixed Effects tool (FLAFE) and thresholding clusters of z >2.3 at Pcorrected<0.05 for: alerting (top), orienting (middle), and executive control (bottom).