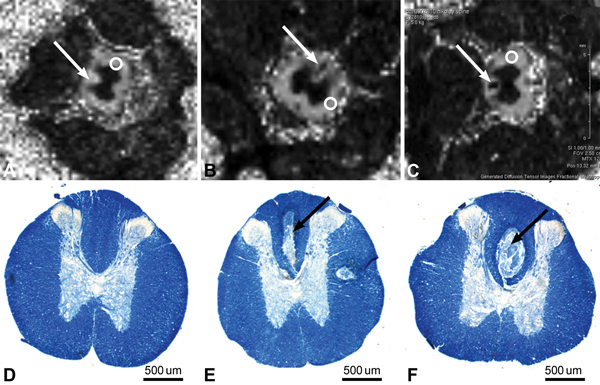
Fig. (3) Axial MRIs of spinal cord 10 mm rostral to injury epicenter. (A) FA map of spinal cord of control animal. Arrow shows dorsal column. Circle indicates area of lateral white matter that served as FA control. FA map of spinal cord of (B) SCIH animal and (C) SCIT animal. Arrows show dorsal column lesion. Circles indicate area of lateral white matter that served as FA control. (D-F) Photomicrographs of spinal cord sections 10 mm rostral to injury epicenter: (D) control animal; (E) hemisection animal; and (F) transection animal. Arrow shows dorsal column lesion. Luxol fast blue myelin stain. Scale bar 500 μm. Used with permission from Barrow Neurological Institute, Phoenix, Arizona.