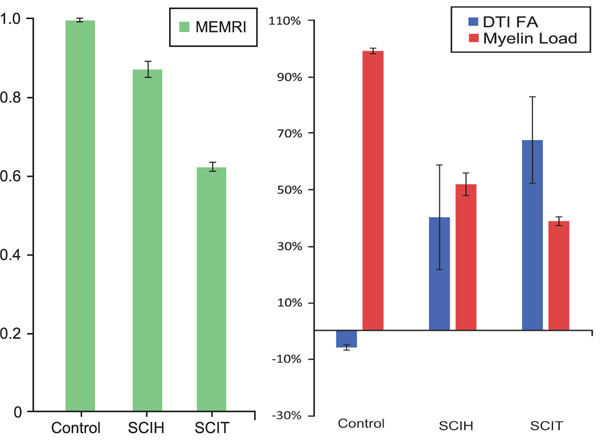
Fig. (4) (A) MEMRI T1-signal intensity ratio and (B) DTI FA percentage change and myelin load in control, hemisection (SCIH), and transection (SCIT) groups. In transection and hemisection groups, MEMRI ratios were lower than in control animals. In transection and hemisection groups, there was an FA decrease and in the control group the FA increase was calculated (P<0.05). In the transection and hemisection groups, there was a decrease in myelin load compared to the control group. Error bars show mean standard deviation. Used with permission from Barrow Neurological Institute, Phoenix, Arizona.