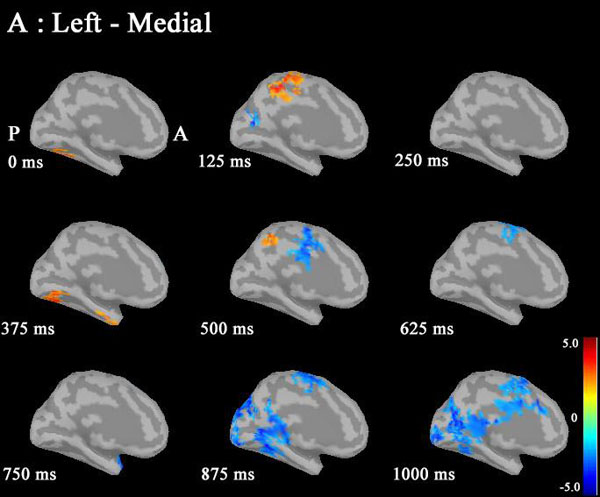
Fig. (2)
Statistical source maps of differences in t values (p<0.05) at 30-50 Hz. A: In the sagittal image in the left hemisphere, ERS in males was increased in the paracentral region at 125 ms. ERD in males was increased in CGp at 500 ms, in the superior frontal, isthmuscingulate, lingual and superior parietal regions at 875ms, and in the superior frontal, isthmuscingulate, pericalcaline, lingual and lateral occipital regions at 1000ms. B: ERS in males was increased in the right temporal region at 0 ms, and in the precuneus and fusiform regions at 125 ms. ERD in males was increased in the lingual region at 250ms, in the superior frontal and paracentral regions at 625ms, in the superior frontal region at 750 ms, in superior frontal and paracentral regions at 875ms, and in the posterocingulate and medial orbitofrontal regions at 1000 ms. (P: posterior, A: anterior, ERD: event-related desynchronization; ERS: event-related synchronization; CGp: posterior cingulate cortex).