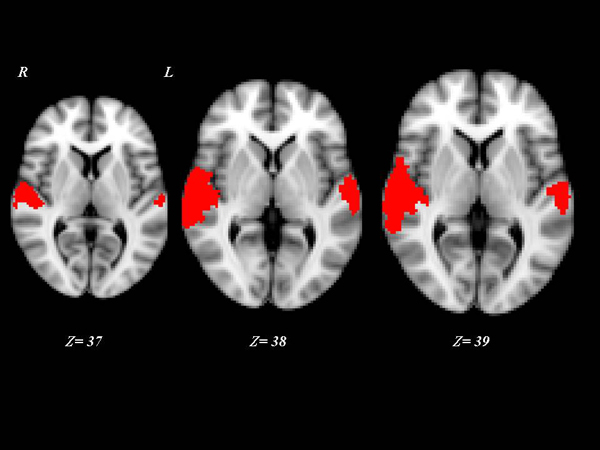
Fig. (3)
Post-hoc contrasts where both “VS converted” were compared with MCS and “VS converted”. Red shows activated brain areas (p<0.01, cluster corrected) as results of a subtraction analysis among activation VS stable, MCS and VS converted patients. Z coordinates are expressed in mm.