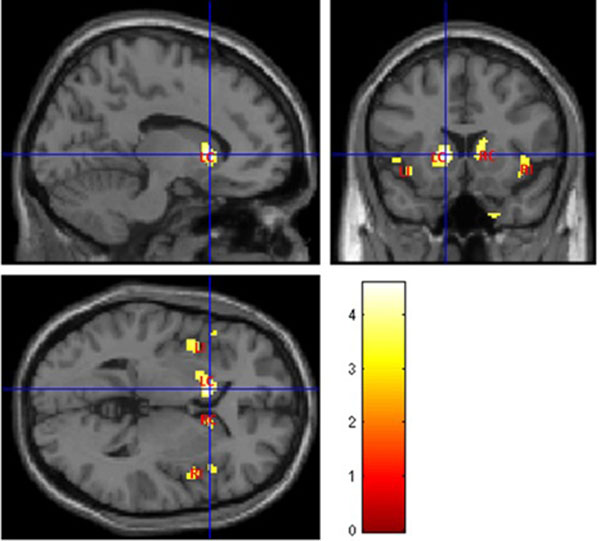
Fig. 4 Areas with abnormal gray matter in T2DM patients (p<0.001, uncorrected, extent threshold k = 10) when compared with controls, using ANCOVA with T2-weighted images. The color bar indicates the range of t-values with white/yellow representing more significant differences (higher t-values), orange indicating less significant differences (middle range t-values) and red indicating non-significant differences (lower t-values). LC – Left Caudate; RC – Right Caudate; LI – Left Insula; RI – Right Insula.