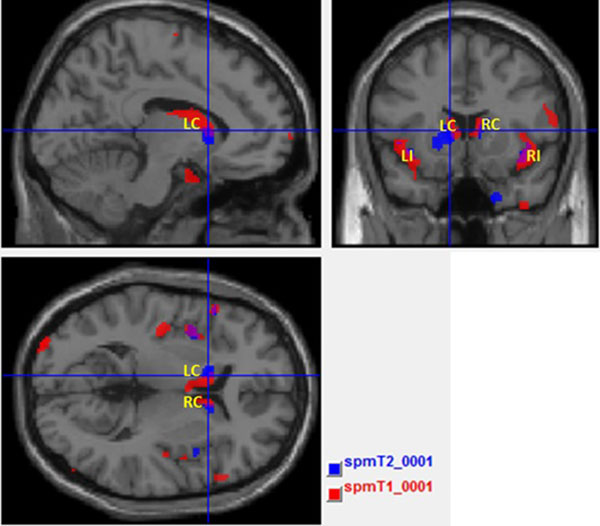
Fig. (5)
Overlapping of T1- (red clusters) and T2-weighted (blue clusters) univariate VBM analyses. The purple clusters correspond to the overlapped areas. LC – Left Caudate; RC – Right Caudate; LI – Left Insula; RI – Right Insula.