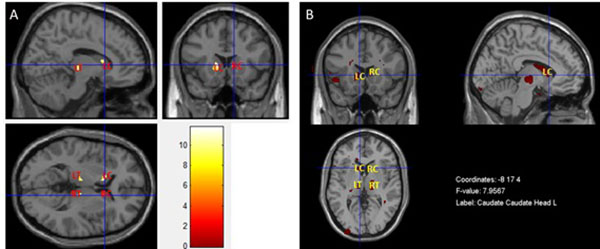
Fig. (6) (A) Areas with less grey matter volume and concomitant pathology in T2DM patients (p<0.001, uncorrected and extent threshold k = 10) when compared with controls, using a MANCOVA design with T1 and T2 scans simultaneously, implemented in SPM (color bar represents the range of F-values calculated, in which red corresponds to lower F-values and yellow corresponds to greater F-values). (B) Areas with less grey matter volume and concomitant pathology in T2DM patients (p<0.001, uncorrected) when compared with controls, using the same data with a MANCOVA design in the MRM toolbox. LC – Left Caudate; RC – Right Caudate; LT – Left Thalami; RT – Right Thalami.