Fig. (1)
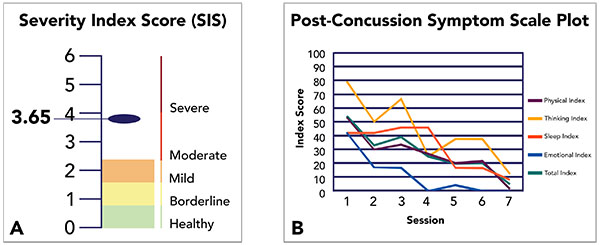
Method for Visualizing SIS and PCSS Scores Before, During, and After Treatment. Severity Index Scores (A) and Post-Concussion Symptom Scales (B) are graphically displayed for clinical purposes as shown above. A) The SIS score for an individual patient is displayed in the context of Healthy, Borderline, Mild, Moderate, and Severe ranges of PCS biomarker presence. B) Symptom subscales and total index scores are displayed for each day during treatment to track patient progress.