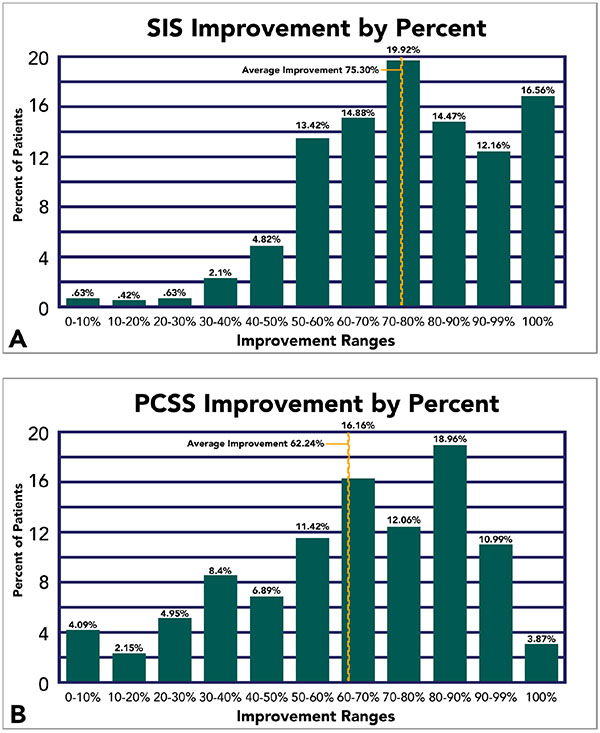
Fig. (4)
Improvement on SIS and PCSS Measurements. Average percent improvement is displayed for fNCI-based SIS outcomes (A), and PCSS outcomes (B). The percentage of patients (not cumulative) falling within each 10% improvement interval is displayed, as well as the percentage at 100% for both measures.