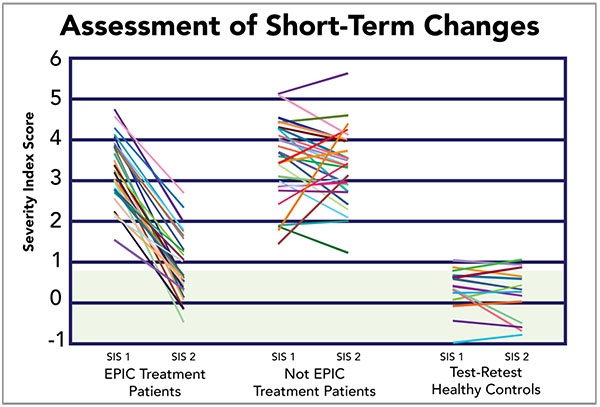
Fig. (5)
Assessment of Short-Term Changes on the SIS Measure. Random selection of patients who underwent EPIC treatment (1st column), patients who elected not to participate in EPIC treatment (2nd column) and healthy controls (3rd column) were scanned at pre- and post-treatment time intervals. Green shading indicates normal SIS range.