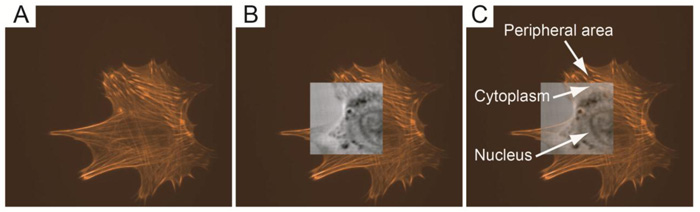
Fig. (4)
Optical and acoustic images of embryonic chicken heart muscle cells: (A) Fluorescence micrograph of an embryonic chicken heart muscle; (B) acoustic acquisition using TRSAM at a center frequency of 860 MHz in focus (z = 0). The optical image from “A” and the acoustic acquisition are shown as a 100% opaque overlay; (C) acoustic image overlaid on the fluorescence micrograph with opacity reduced to 70%. The field of view for the acoustic acquisition was 65×65 μm (Figure from Weiss, Lemor et al. © 2007 Ultrasound in Med. & Biol.).