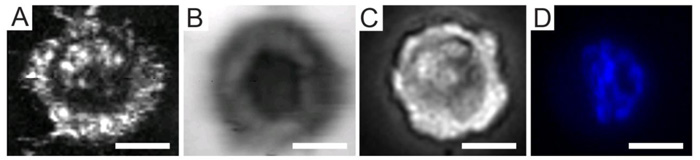
Fig. (7)
MCF-7 breast cancer cells investigated by TRSAM at 1 GHz: (A) Backscatter image of an apoptotic MCF-7 cell; (B) attenuation distribution across the cell depicted in panel “A”; (C) optical micrograph of the cell in panels “A” and “B”; (D) a fluorescence micrograph of the same MCF-7 cell shown in the previous panels. Interestingly, the darker area in “B” coincides with the stained nucleus as shown in the fluorescence image. This is characteristic of apoptotic cells as this type of overlap has not been observed with apoptotic MCF-7 cells. The scale bar in all panels corresponds to 15 µm (images are courtesy of Michael Kolios and Eric Strohm, Ryerson University, Toronto, Canada).