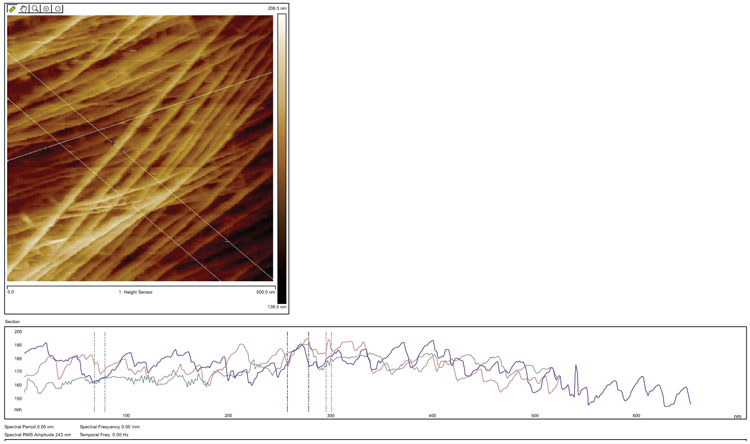
Fig. (9)
Post image processing of celery microfibrils topography or height image. Three graphs above corresponded to the three lines show in the image which gives the height distribution for those selected lines. Based on the results, a very small microfibril was about 5 nm (red) in diameter, the distance between them at some points was about 10 nm (green), and one of the big microfibrils was about 21 nm in diameter.