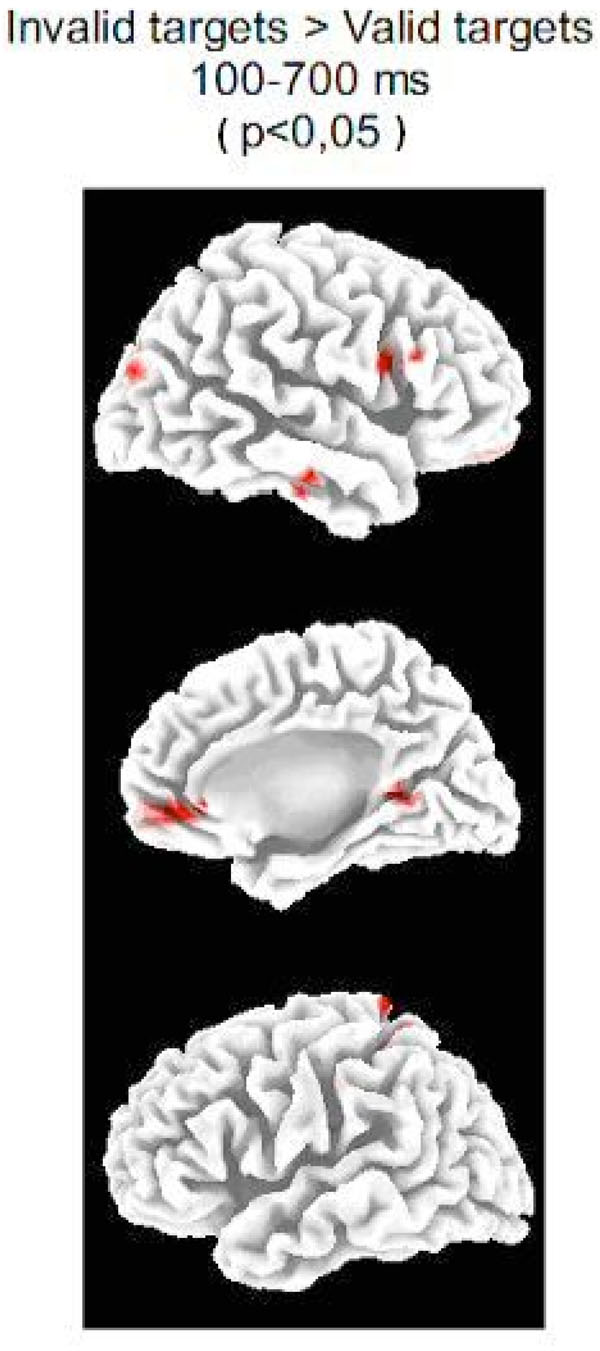
Fig. (3) Source analysis .Statistical differences (the p-value appears in parentheses) of the LORETA solutions of IC and VC targets for the whole post-target epoch (100-700 ms) in the mesial and lateral surfaces of both hemispheres. Notice the statistically significant increase of activity in the Superior Occipital Gyrus (BA19) and Inferior Frontal Gyrus (BA 44 and 45) in the invalid condition with respect to the valid condition (see Table 1 for a complete description of areas activated differentially in the IC targets with respect to the VC targets).