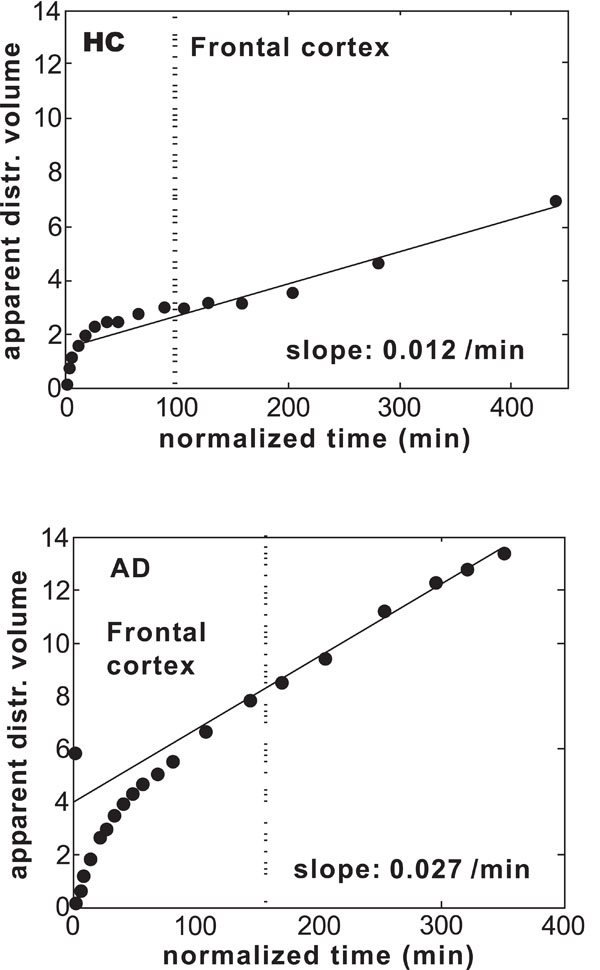
Fig. (2)
Gjedde–Patlak plots for frontal cortex in (
a
) one subject in the HC group and (
b
) one patient in the AD-Hi group. The straight lines were fitted to the data in the time interval 30–60 min.