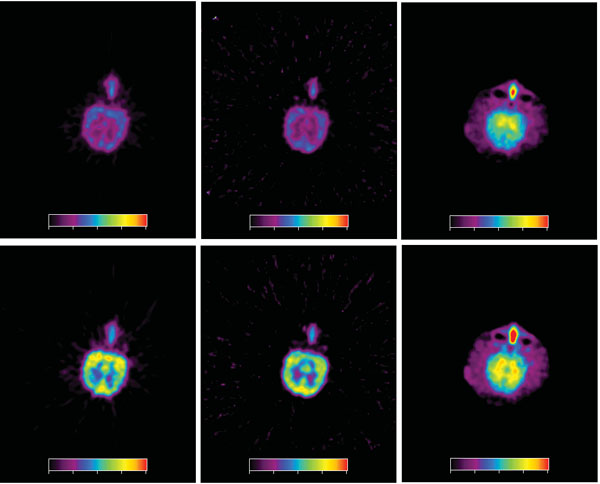
Fig. (4) Parametric maps for PIB. Data from the same two experiments as in Fig. (2) were used. The maps show Kacc (left column) and K1, (right column) for one HC (upper row) and one AD-Hi subject (lower row). For Kacc the colour scale goes from 0.01 to 0.055 min-1, and for K1 the scale goes from 0.0 to 0.5 min-1.