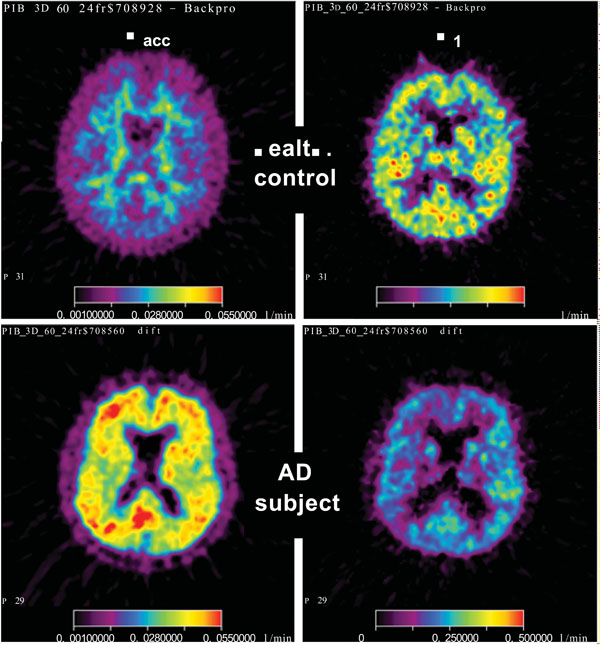
Fig. (5) Parametric maps from one brain slice in the monkey experiment. The upper row shows maps from the baseline experiments (from the left: CBF, K1, Kacc), and the lower row shows the corresponding maps after increased PaCO2. For CBF the colour scale goes from 0.02 to 0.7 ml g-1 min-1, for K1 the scale goes from 0.04 to 0.7 min-1, and for Kacc the scale goes from 0.01 to 0.07 min-1.

