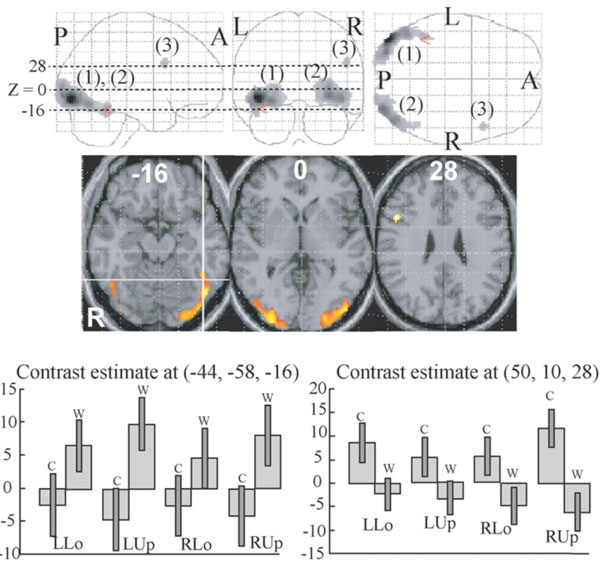
Fig. (2) Regions whose activities were significantly different between colour and word task (P < 0.01, corrected for multiple comparisons using false discovery rate, k > 20 voxels). They are displayed on a glass brain (upper) and on the axial images of the MNI template (middle).Figures in glass brain and the axial images refer to the axial coordinates of MNI space. The red arrowhead in the upper and the intersection oflines in the middle correspond to the centre of the VWFA defined by meta-analysis [54]. Two large clusters (1, 2) showed greater activationfor words than for colours and one small cluster (3) showed greater activation for colours than words. Contrast effect of the centre of theVWFA defined by meta-analysis (lower left) and that of the activation peak of the cluster (3) (lower right). Bars represent the limit of the 90% confidence interval around the mean.